If you spent the summer watching Jacksonville listings and waiting for prices to cool, August finally gave a little. The August numbers from realMLS show the median price slipping about 1% from July. Buyers got a slightly softer price, but even fewer homes to pick from. Sellers still held the stronger hand, with the typical home selling in about a month. And for military families, the report date on your orders matters far more than a 1% move either way.
Table of Contents
 Jacksonville Home Prices and Inventory: August at a Glance
Where Jacksonville sat in August (months of supply)
Under 6 months: leans toward sellersAbout 6: balancedOver 6: leans toward buyers
The bar shows months of supply: how many months buyers would need to work through every home for sale if nothing new got listed. About six is considered balanced, and below that sellers have more leverage. Single-family homes were at 3.7 months in August, firmly on the sellers’ side.
$355,250
Median sales price
34 days
Median days on market
9,373
Homes for sale
3.7
Months of supply (single-family)
By county
| County | Median price | Days on market | Months of supply | Inventory vs Aug. 2025 |
|---|---|---|---|---|
| Duval | $314,250 | 30 | 4.1 | -17.9% |
| St. Johns | $505,000 | 39 | 4.0 | -29.0% |
| Clay | $350,000 | 32 | 4.7 | -4.8% |
| Nassau | $415,000 | 51 | 4.5 | -13.7% |
County figures: realMLS Market Review, August 2026, all property types, as pulled for this update in September 2026.
| Metric | Aug. 2026 | vs July 2026 | vs Aug. 2025 |
|---|---|---|---|
| Closed sales | 2,370 | -7.9% | -3.2% |
| Median sales price | $355,250 | -1.0% | -0.9% |
| Median price per sq ft | $199 | -1.0% | -1.0% |
| Median days on market | 34 | +6.3% | -18.1% |
| Active inventory | 9,373 | -3.5% | -19.0% |
| New listings | 3,132 | -9.0% | -9.2% |
| Single-family median price | $387,250 | – | – |
| Single-family days on market | 31 | – | – |
| Single-family list price received | 97.8% | – | – |
| Single-family sold over list | 12.4% | – | – |
| Single-family months of supply | 3.7 | – | – |
Source: realMLS Market Review, August 2026, data updated 09/24/26. Top six rows are all property types; the last five are single-family only, and their monthly and yearly changes weren’t part of this update’s data. Layout refreshed October 8, 2026; figures unchanged. For the next month, see the October 2026 Jacksonville market update, or browse all of our Jacksonville market updates.
 Buying a Home in Jacksonville After the Summer Rush
Price was the bright spot for buyers. The median eased to $355,250, a touch under both July and last August. That won’t rewrite a budget, but it shows sellers can’t simply keep raising prices.
Supply is the harder part. Inventory, all the homes listed for sale at one moment, was 19.0% lower than a year earlier, and new listings fell from July.
Days on market is the stretch between a home’s listing and its sale. The August median was 34 days, a little slower than July but much quicker than a year ago, so a well-priced house still doesn’t wait long.
 Buying With PCS Orders or a VA Loan Near NAS Jax and Mayport
If your orders bring you to Jacksonville this fall, you’ll shop a thinner market than families who came last year. The report date on those orders sets the clock; the market only decides how many choices you get.
That makes preparation worth more than timing: get pre-approved early, narrow neighborhoods by commute before the house-hunting trip, and decide whether renting first makes sense. Our 90-day PCS to Jacksonville plan lays out what to handle and when, and our guide to VA loan limits and buying power in Jacksonville shows how entitlement shapes your price range.
Selling a Jacksonville Home in Early Fall
Sellers were still getting close to full price. Single-family homes sold for 97.8% of list in August, and about one in eight went over asking.
Pricing is where August asked more of sellers. With the median easing, buyers are comparing recent sales closely, and a home listed above them tends to sit. Fewer new listings means less competition, but only a well-priced home gets the benefit. If orders set your move date, plan on about a month of market time before closing even starts.
Jacksonville Mortgage Rates When This Update Was Published
Freddie Mac’s Primary Mortgage Market Survey had the average 30-year fixed rate at 7.03% on September 24, 2026, up from 6.95% a week earlier and 6.30% a year before. On a $355,000 loan, principal and interest work out to about $2,369 a month, roughly $172 more than at the year-earlier rate, before taxes and insurance.
That survey reflects conventional loans with 20% down. If you’re using a VA loan, ask a lender for a VA quote on your own numbers. Our October update has the newer reading.
Duval, St. Johns, Clay and Nassau County Markets in August
Duval County
Duval suits buyers who want the most choices, with NAS Jacksonville and Naval Station Mayport both inside the county; homes around Mayport keep the drive to the Mayport gate short. The median sale price was $314,250, up 1.4% from August 2025, with 4.1 months of supply. Browse Duval County homes for sale.
St. Johns County
St. Johns fits families with a bigger budget who put schools first, in places like Nocatee and St. Augustine. Without traffic, Nocatee is roughly 40 minutes from NAS Jax or Mayport, and St. Augustine is closer to an hour. The median sale price was $505,000, up 5.6% from August 2025, with 4.0 months of supply. See St. Johns County homes for sale.
Clay County
Clay is where many families look for more house for the money near NAS Jax, around Orange Park and Oakleaf. The median sale price was $350,000, up 6.1% from August 2025, with 4.7 months of supply. See Clay County homes for sale.
Nassau County
Nassau fits buyers who want a slower pace around Yulee and Fernandina Beach. With Kings Bay orders, the drive from Yulee up I-95 to the base is roughly a half hour, and we keep the search on the Florida side: Yulee, Fernandina Beach and north Jacksonville. The median sale price was $415,000, down 4.5% from August 2025, with 4.5 months of supply. It’s the smallest of the four markets, so one month can swing a lot. See Nassau County homes for sale.
Source: realMLS (Northeast Florida MLS), August 2026 data.
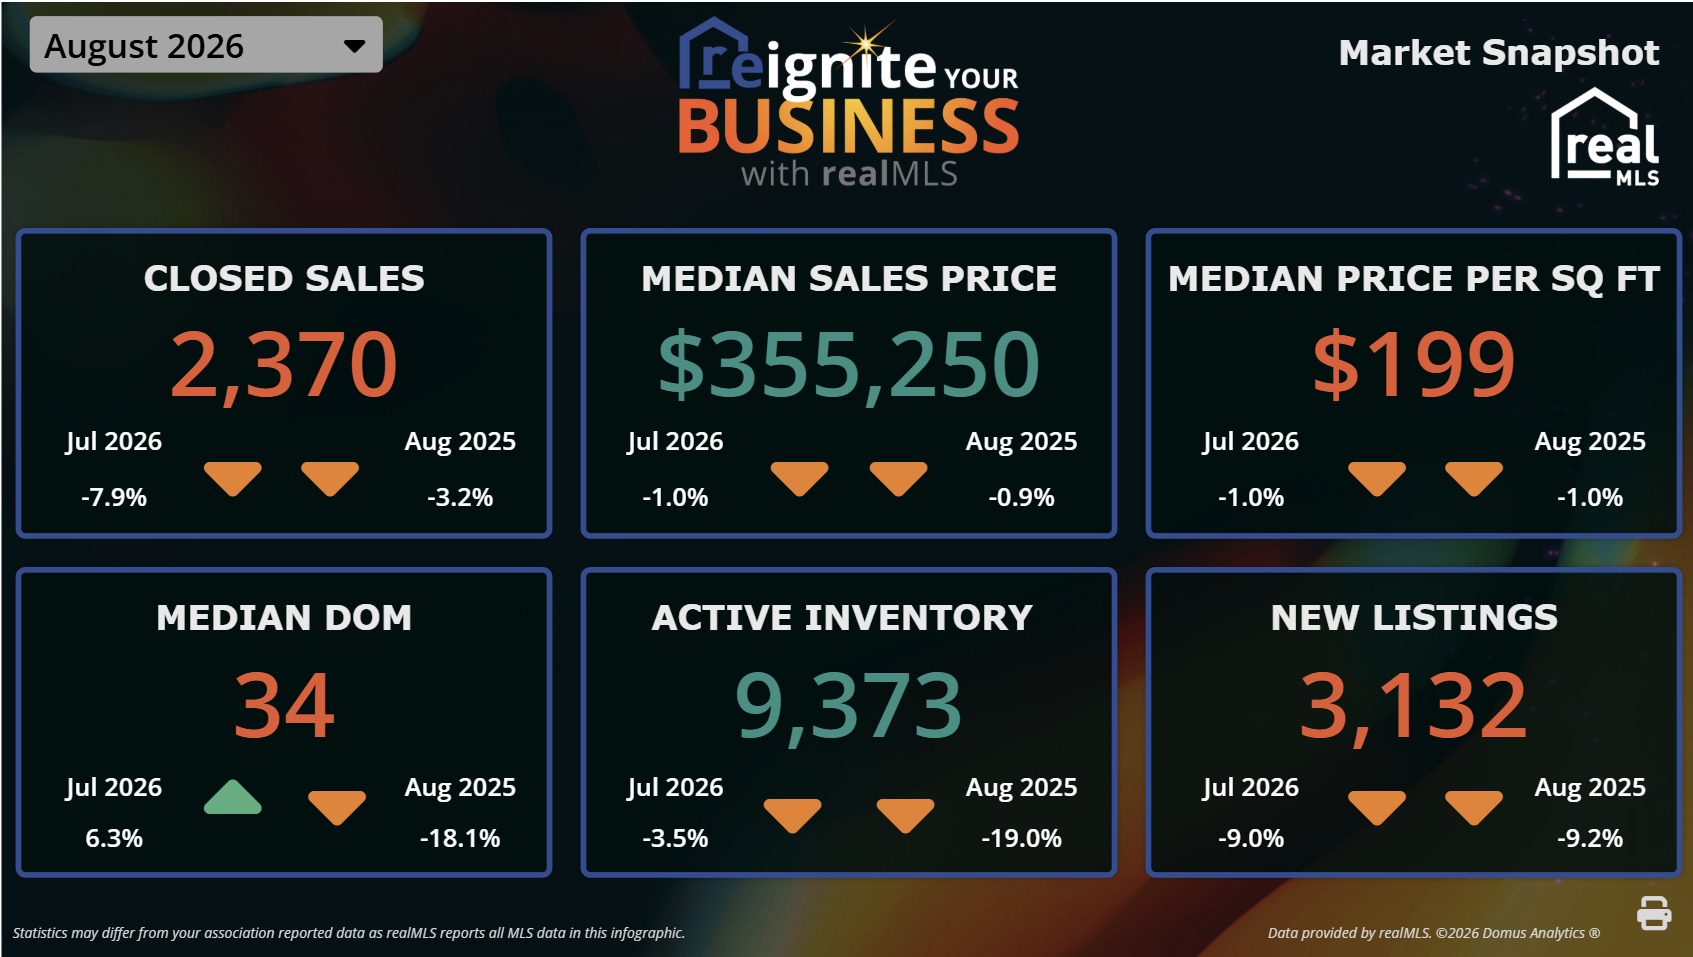
Data provided by realMLS. ©2026 Domus Analytics®
Have a Home in Mind?
If there’s a house or a neighborhood you’ve been keeping an eye on, we’re always happy to look at how it compares to these numbers. No pressure, just an honest read from people who know the area. Our team, led by broker-owner Matt Strickland, a retired Navy officer, works with military and civilian families across Duval, Clay, St. Johns and Nassau counties.
Call or text (904) 309-0609For education only. This update summarizes published realMLS and Freddie Mac data and is not financial, lending or legal advice. Talk with your lender about rates and loan terms.